Graphes
En outre, vous pouvez accéder aux composants du projet : le modèle Graph, les Instances du graphe, et les datasources.
Le modèle de graphe est accessible via la fonction .graph() :
my_project = wg.project_from_id("<Votre ID de projet>")
g = mon_projet.graph()
La classe Graph hérite de la bibliothèque NetworkX. Cela signifie qu'il est possible de créer une méthode d'affichage à votre convenance dans la classe Graph :
import matplotlib.pyplot as plt
"""Displays the graph using NetworkX library"""
# Using the kamada kawai layout algorithm
pos = nx.kamada_kawai_layout(g)
# Set the START node to green and the END node to red
color_mapper = {"START": "green", "END": "red"}
labels = {n: g.nodes[n]["name"] for n in g.nodes} # Use name as label
colors = [color_mapper.get(g.nodes[n]["name"], 'blue') for n in g.nodes] # Set nodes colors (default to blue)
# Draw and show the graph
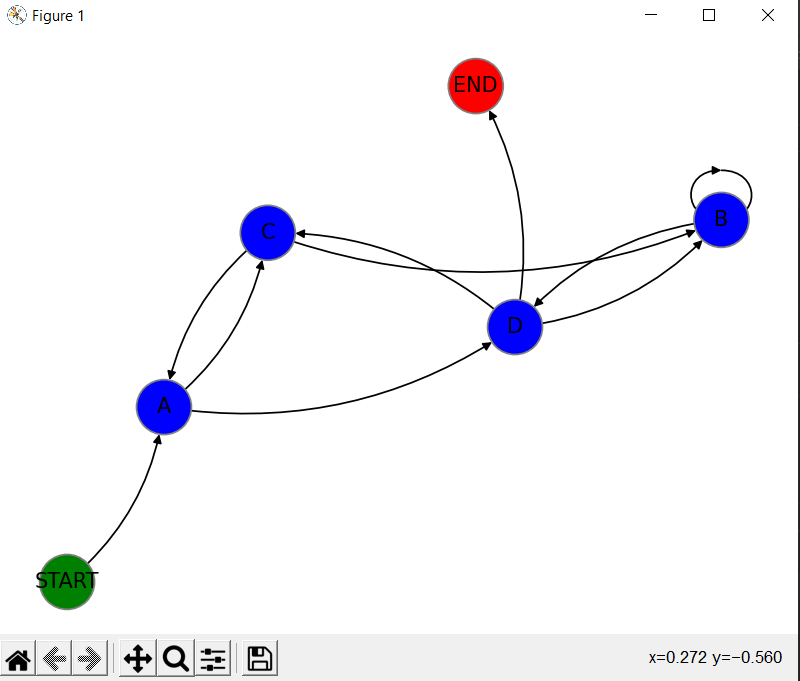
nx.draw(g, pos=pos, labels=labels, node_color=colors, node_size=1000, connectionstyle='arc3,rad=0.2')
plt.show()
Elle nous donnera un graphique similaire à celui qui suit :
Le graphique peut ensuite être sauvegardé en tant que GEXF :
nx.write_gexf(g, 'nom_du_graphique.gexf')
Il peut également être sauvegardé au format GML :
nx.write_gml(g, 'nom_du_graphique.gml')